The Identity, Culture, and Languages category welcomes submissions that focus on exploring elements of identity, culture, or languages, through the written word. This category seeks writing that investigates the human experience, particularly through perspectives that are frequently marginalized or excluded, which may include members of the LGBT+ community, people with disabilities, non-citizens, and multilingual writers. Submissions are open to projects written in any course, at any level. There are no length limits for this category. Amelia Jobe wrote the 1st place submission in the Identity, Cultures, and Languages category for the 2025 President’s Writing Awards.

About Amelia
Amelia Jobe is a fourth-year student at Boise State University pursuing a BS in Sociology with minors in Gender Studies, Ethnic Studies, and Computer Science. They are deeply passionate about sociological research, with a particular interest in how technology intersects with other identities and institutions to shape systems of oppression. For the last two years, Amelia has been a researcher and mentor in the Intermountain Social Research Lab (IMSRL). There, she researches the impact of gender and neoliberal precarity on student experiences in higher education. This year, she also became a researcher in the Social Community Research Lab (SCRL). In addition to their research with IMSRL and SCRL, they have also conducted research on the gendered language of tech job postings, the impact of generative AI on collaboration in academic settings, and the impact of free breakfast on K-12 students. Outside of Sociology, she enjoys spending time with loved ones, snuggling with her cat Jahoda, cooking, and baking. She is honored to be selected for this year’s Presidential Writing Awards, and thanks you for reading her work.
Winning Manuscript – Exploring the Impact of Systemic Racism on Boise’s Public Transit System
Introduction
Despite being one of the richest countries in the world, the quality of the United States’ transportation system is far worse than similarly wealthy countries throughout Europe and Asia. Only 11% of Americans report taking public transportation on a daily or weekly basis (Anderson, 2016). Even in the Northeastern part of the US, which has the highest ridership rates in the US, only 25% of people report using public transportation on a daily or weekly basis (Anderson, 2016).
Why is public transportation in the United States so bad? What impact does systemic racism play in the design of transit systems? How are emerging cities building structural racism into their transportation systems? To answer these questions, I conducted qualitative map comparison research and qualitative media analysis to determine the ways that structural racism is shaping the emerging transit system of Boise, Idaho. Through my research, I found that structural racism is being built into Boise’s transit system through a reduction of service to lower-income and racially diverse areas, reliance on a hub-and-spoke development model, and a prioritization of choice riders through the use of express lines and cosmetic, rather than structural, improvements.
Historical Background for America’s Public Transit System
Before analyzing Boise’s public transit system, it is important to understand the history of public transportation in America today.
Highway Projects and the Interconnectedness of Cities
Jim Crow laws and redlining worked to racially segregate American cities. In the middle of the 20th century, when white flight was at its peak, white people began leaving city centers for whiter, wealthier suburbs. The emergence of these suburbs required the development of a robust highway and road system that connected those on the outskirts of town to the city center (Stromberg, 2015). To develop these highway systems, cities would build through black and brown neighborhoods (NYU Center on Race, Inequality, and the Law, 2024). These developments prioritized white comfort and mobility at the expense of communities of color. The construction of highways worked to isolate these communities from other parts of town while also introducing environmental, health, and safety hazards into these neighborhoods. This systematic destruction of black and brown neighborhoods reduced market value in these areas, resulting in underdevelopment and neglect for infrastructure (Purifoye, 2020; Sen, 2020).
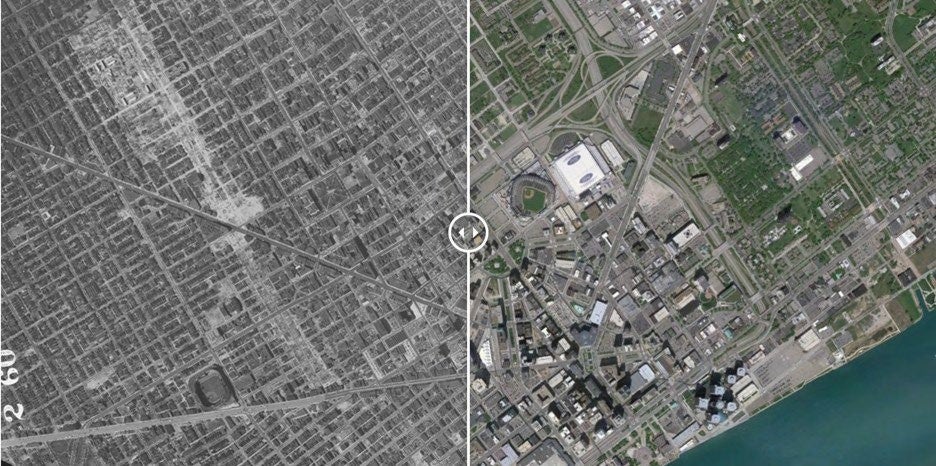
While the development of highways through city centers eroded communities and introduced health and environmental issues, this highway-ification of American downtowns also shaped the structures of American mass transit systems. In the image above of Detroit in 1951, the city center was designed around a near-perfect grid. This grid pattern allowed for efficient routes throughout the city and made moving between neighborhoods easier. This grid system also meant that it was easier for public transportation to connect different parts of the city. Since 1951, however, massive highway construction projects within the city center have destroyed this interconnected road structure. This restructuring isolated communities from one another and made mobility without a car significantly harder in the city.
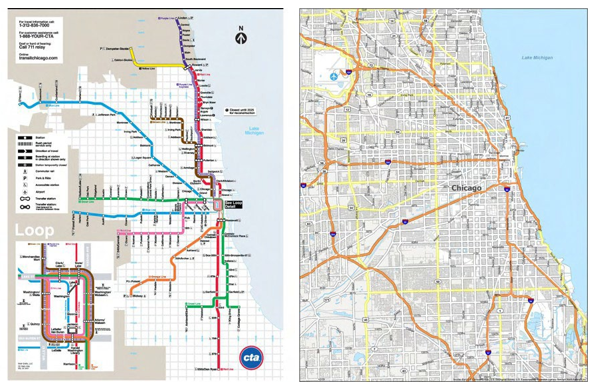
The construction of highways also has the power to shape the routes in cities dedicated to public transportation. Look at the images of Chicago below. The picture on the left displays the Chicago metro system, which is one of the most used metro systems in the country. Instead of a grid pattern, the Chicago public transit system is designed on a hub-and-spoke system. This design works to connect the suburbs of Chicago with downtown, rather than connecting neighborhoods within the city, which results in metro lines directly mirroring highway systems. This system of connecting suburbs to downtown, rather than connecting different neighborhoods, disproportionately impacts black, brown, low income, and immigrant communities. In an ethnographic study of Chicago, Purifoye (2020) highlights that white mobility in cities is prioritized and made as comfortable as possible, while communities of color are served by less public transit routes, resulting in community isolation.
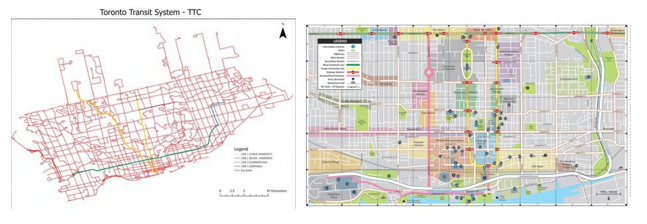
While it is easy to blame the poor quality of American public transportation on urban sprawl and the car, it is important to remember that other cities that were developed in a sprawling fashion are still capable of having high-quality, interconnected public transportation. The images below depict the Toronto public transit system (left) and the street grid of the city (right). Despite the fact that Toronto is developed around cars and contains major roads, these roads are still organized in a grid-like fashion, allowing for interconnectedness between different parts of the city. Because there are no major highways cutting through and isolating neighborhoods, there is more of an equal distribution of transportation resources throughout the city.
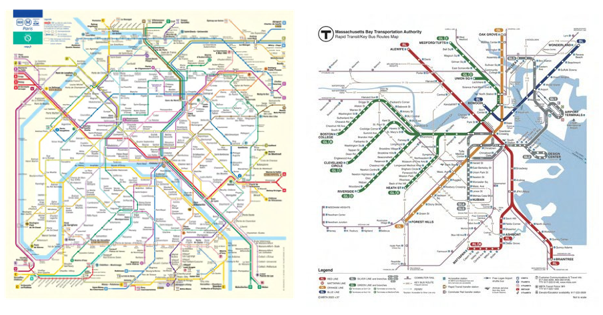
It is also important to note that this emphasis on interconnectedness does not have to be dictated by road systems. Take the two pictures below as an example. The map to the left depicts the Paris metro system, which is often regarded as one of the best in the world. Despite being nearly all underground, the different lines are designed with concentric circles connecting the different lines that all meet in the center of the city. These concentric circles make it easy to move between different neighborhoods and parts of the city. By contrast, Boston’s metro system, depicted below on the right, only has a small area where all of the lines intersect. Similar to Chicago’s public transit system, pictured above, this metro system is designed to connect suburbs to city centers, rather than working to connect different neighborhoods within the city. As a result, neighborhoods that have already been historically segregated through racist policies continue to be isolated from one another.
Through the analysis of these maps, a trend emerges: American metro systems are designed for suburban interests, whereas systems outside of the US are designed for inter-neighborhood interests. The lack of interconnectedness in American transit systems reduces inter-neighborhood movement efficiency tremendously, which leaves many Americans making the convenient decision of driving a car rather than taking public transit.
An Analysis of Boise’s Valley Regional Transit Proposal
This year, the City of Boise and Valley Regional Transit (VRT) announced a proposal to restructure the Boise bus system. Although Boise’s transit system is relatively immature compared to many larger American cities, this proposal is building structural racism deeper into the city.
Before I begin to discuss the VRT proposal, I would like to define some key terms that I will be using throughout my analysis of the Boise public transit system. A dependent rider is someone who is dependent on the public transit system to get around (Spiller, 2020). Dependent riders are predominantly, black, latino, low income, or from immigrant populations (Spiller, 2020). In contrast, a choice rider is someone who has access to a private vehicle but is choosing to use public transportation (Spiller, 2020). Choice riders tend to be largely white, live in the suburbs, and are medium to medium-high income (Spiller, 2020).
Because dependent riders rely on public transportation, they are often labeled as “not picky” and given lower-quality transportation. Transportation routes serving dependent riders often do not have stop covers, run more infrequently or are less predictable, may utilize older, out-of-date equipment, or may be passed up for maintenance and upgrades (Spiller, 2020). On the flip side, choice riders are often viewed as needing to be enticed into using public transit. Oftentimes, this means that routes serving choice riders will have more comfortable waiting areas, routes may run more frequently, routes may have better signage indicating any delays, and will often have more amenities (Spiller, 2020).
From the beginning of the proposal, VRT indirectly announces that they are going to prioritize choice riders. They write that “all scenarios reduced the bus service area, but increased service in high ridership areas” (Valley Regional Transit, 2023). By reducing service area, VRT is directly harming riders who are dependent on the bus system for mobility; although increased service frequency makes riding public transportation more attractive for all riders, it should not come at the expense of riders dependent on the system for autonomy and freedom of movement.
Later in the proposal, VRT highlights their explicit efforts to attract choice riders, stating:
“VRT will acquire up to six new battery electric buses equipped with VRT’s new onboard infotainment systems, providing a more comfortable, reliable, and environmentally friendly experience for passengers… Improvements will include an updated passenger waiting area, additional bus bays, solar panels, on-site electric bus charging, public restrooms, dedicated space for bus operators, and enhanced security.”
Reducing service area to fund the purchase of “infotainment systems” for a more “comfortable” riding experience is a direct attempt to entice choice riders. Cosmetic updates to waiting facilities, bus interiors, and transit hubs are, again, direct attempts to market the Boise transit system to choice riders. These attempts are driven by neoliberalism, which has resulted in similar cosmetic updates at the expense of service quality in several other cities in the United States (Farmer, 2014).
Finally, the increased police presence and “enhanced security” is a blatantly racialized attempt to ensure that the choice riders being attracted to the bus system are white. In Carter and Johnson’s 2023 work “‘Blacks Can’t Jump’: The Racialization of Transit Police Responses to Fare Evasion,” they found that black people were more likely to be fined and given citations for fare evasion in white neighborhoods and in high-traffic areas. The increased police presence in these spaces served to protect “white comfort” and the expense of young black men. The deployment of police officers on transit systems in Boise also serves to maintain white comfort.
Comparing Boise’s Transit Map to Demographic Maps
One of the clearest ways to visualize the ways that the VRT proposal will be building off of structural racism and inequity is by looking at various demographic maps of Boise.
The first map, pictured below, depicts the proposed new VRT bus routes. Green lines run Monday through Saturday every 15 minutes during peak hours and every 30 minutes during non-peak hours. Blue lines run Monday through Saturday every 30 minutes during peak hours
and every 60 minutes non-peak hours. Purple lines run Monday through Friday every 30 minutes during peak hours and do not run during non-peak hours. Blue shaded areas are covered by an on-demand system, which requires an advanced registration.
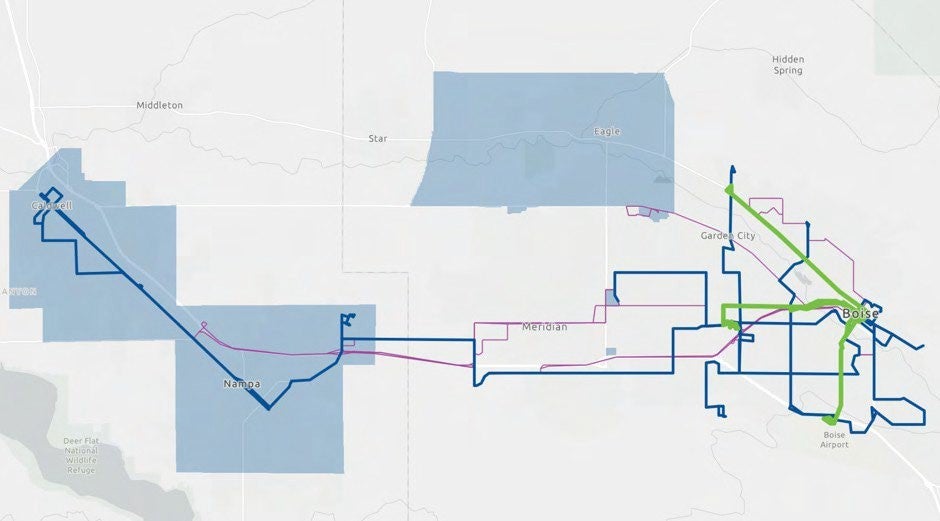
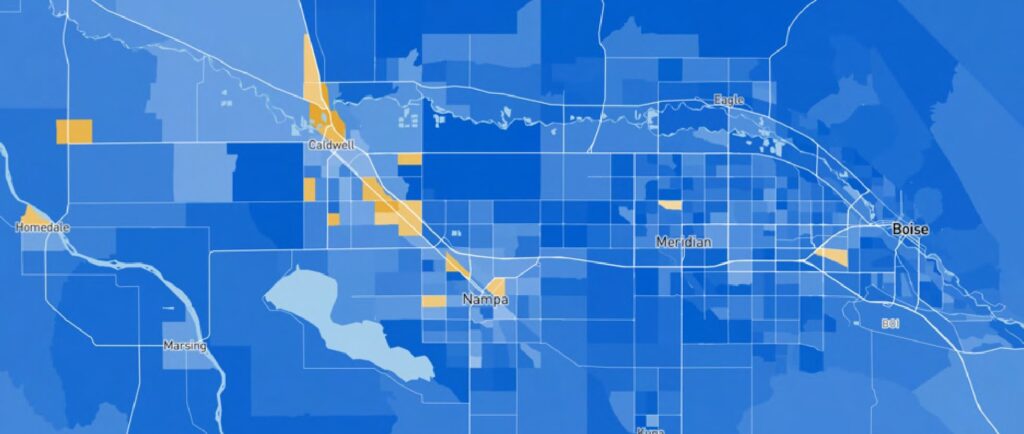
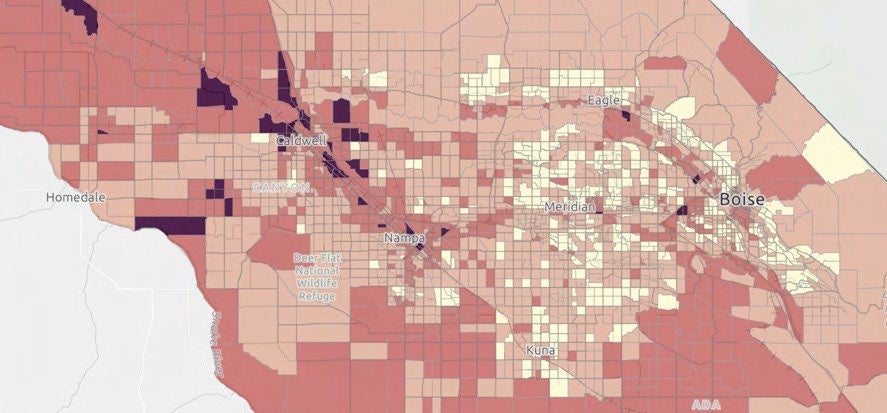
Areas that are receiving the most frequent transportation access are all connected to downtown Boise. Although on a smaller scale, the design of the green lines reflects the hub-and-spoke system of the other American metro lines described earlier. While there are small amounts of interconnectedness within areas of Boise close to downtown, this interconnectedness does not extend to Boise’s close neighbors Nampa and Caldwell. When compared two the two maps below, which depict the racial and ethnic makeup of Boise (top) and the rates of inequity in Boise (below), it becomes clear that Boise’s public transit system is designed along racial lines.
As stated in VRT’s proposal, interconnectedness and size of service area is no longer the chief concern for Boise’s public transit; comfort and convenience for white choice riders are the new top priorities.
Dependent vs. Choice Riders: Line 42 vs. Line 40 Express
Lines 42 and 40 are the only two dedicated lines that connect Caldwell and Nampa to the rest of Boise. Despite running nearly identical paths, there is one key difference: line 42 is designed for dependent riders while line 40 is designed for choice riders.
Line 42 is designed for dependent riders. It is a standard blue line, meaning that it runs every 30 minutes during peak hours and every 60 minutes during off-peak hours Monday through Saturday (Valley Regional Transit, 2024). It takes 70 minutes to ride the entire line from start to finish. To get from the same starting point to the same endpoint, it would only take 22 minutes in a private vehicle. Standard fare for the bus is $1.50; an all-day pass for this bus (and all other non-express bus lines in Boise) costs $2.50. The bus does not visit Caldwell and travels as far as to the Town Square Mall. If passengers wish to go downtown or to another part of Boise, they have to transfer.
Express line 40, on the other hand, is designed for choice riders. It is an express purple line, meaning that it runs every 30 minutes during peak hours Monday through Friday, but it does not run at all during no-peak hours. It takes 70 minutes to ride the entire line from start to finish.
To get from the same starting point to the same endpoint, it would take 35 minutes in a private vehicle. A one-way bus ticket for line 40 is $4.50. An all-day bus pass is $7.50. The line runs all the way from Caldwell to Boise State University, visits more desirable destinations, and does not require a transfer to get to downtown.
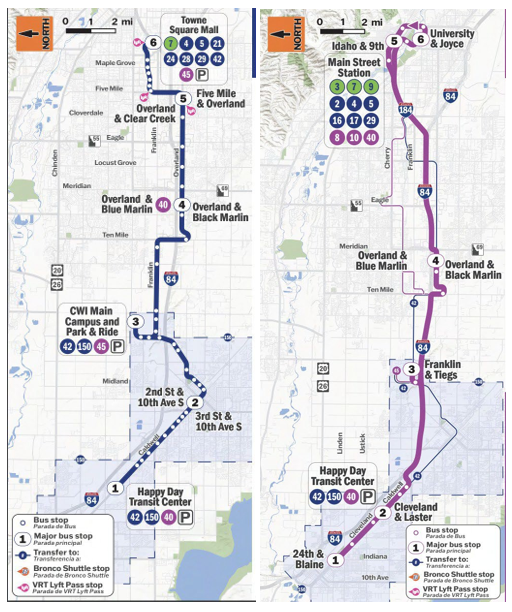
Lines 40 and 42 provide perhaps the clearest evidence of a neoliberal prioritization of choice riders on Boise’s transportation system. If riders are willing to pay 3x as much, they will be provided with a faster, more comfortable ride to more desirable locations.
Conclusion
Although Boise’s public transit system is small, structural racism is already deeply ingrained. Although seemingly beneficial for all riders, new cosmetic improvements are being made at the expense of dependent riders, most of whom are black, latino, low income, or immigrants. My research highlights the reduction of service to lower-income and racially diverse areas, the reliance on a hub-and-spoke development model, and a prioritization of choice riders. In order to build the robust public transit systems that are needed for a sustainable future, structural racism in our transportation infrastructure must be reversed.
Annotated Bibliography
Anderson, M. (2016). Who Relies on Public Transit in the U.S. Pew Research Center. https://www.pewresearch.org/short-reads/2016/04/07/who-relies-on-public-transit-in-the-
u-s/
Only 11% of Americans report taking public transportation on a daily or weekly basis. In the Northeastern part of the US, which has the highest ridership rates in the US, only 25% of people report using public transportation on a daily or weekly basis. Americans who are lower income, black, hispanic, or immigrants are the groups most likely to use public transportation. Even within the highest ridership groups, these numbers still pale in comparison to european and asian countries. This research provides statistics for ridership rates in the US, which will help ground my research paper within the US. Anderson, the author, is a director of research at Pew Research Center, a nonpartisan “fact tank” that conducts quantitative research.
Carter, T. J., & Johnson, L. T. (2023). “Blacks Can’t Jump”: The Racialization of Transit Police Responses to Fare Evasion. Race and Justice, 13(4), 463-487. https://doi.org/10.1177/21533687211007548
This paper highlights the racial disparities in the number of citations given to people for fare evasion on public transit. In the DC area, black riders received 91% of fare evasion citations, despite making up only 50% of the population. Additionally, ¾ of the people receiving citations were men and most were under the age of 25. The paper conducts a statistical analysis of the Washington DC citation data. They have found that while race is not a statistically significant factor in the issuing of citations, black people were more likely to receive citations when they were in predominantly white areas of town or when they were at high ridership locations. They were also more likely to receive a fine rather than a warning when they were in white neighborhoods or at high ridership locations. They write that “being situated in a racialized social system implicitly conveys officers the authority to racialize the punishment decision.” (Carter and Johnson, 2023, p. 464) This increase in citations highlights the issue of black belongingness on public transit and brings attention to the high levels of discretion that police officers have. This article highlights the role that policing plays in public transportation systems. Sen’s article discusses how police are used to create “white comfort” on choice ride systems. This piece adds that policing increases as the need to maintain “white comfort” increases. Both authors are professors in the Justice, Law, and Criminology department at American University.
COMPASS Regional Equity Index. (2024). COMPASS. https://compassidaho.maps.arcgis.com/apps/instant/minimalist/index.html?appid=f9fc986
e99554b6b944b319319408184
This website includes an interactive ArcGIS map that displays the inequality indexes for different regions of Boise. Areas in Caldwell and Nampa have the highest ratings of inequity, whereas wealthier, centrally located districts along hill road, central boise, and meridian rank the lowest in levels of inequity. This map of inequity also takes transportation access into account. The areas with the highest levels of inequity are in regions where the majority of the population is latino. Areas with high inequity map closely to the public transit maps and racial demographic maps.
Downtown Toronto Map. (n.d.). Toronto maps. https://map-of-toronto.com/city-maps/downtown-toronto-map
Farmer, S. (2011). Uneven Public Transportation Development in Neoliberalizing Chicago, USA. Environment and Planning A: Economy and Space, 43(5), 1154-1172. https://doi.org/10.1068/a43409
The neoliberalization of Chicago has resulted in the city putting a majority of their public transit funds into downtown chicago to attract tourists and to attract global capital. Neoliberalism has shrunk public investments in infrastructure, which requires cities to appeal to the wealthy to make ends meet rather than focusing on serving all members of the community. The money that is being spent on surface-level beautification projects means that basic maintenance for lines that serve regular citizens of Chicago are being ignored. Furthermore, lines that serve black and brown communities as well as low income communities are not being invested in via public transport. Transportation hubs create place-based advantages, attract investment in real estate, and facilitate the circulation of capital. Public transit has the power to shape experiences and interactions, and it also is a tremendous source of power. Similar to Spiller’s piece, Farmer’s work emphasizes the prioritization of choice riders, even though she does not explicitly use this language.
Hampton, S. (2014). 60 Years of Urban Change: Midwest. Institute for Quality Communities at the University of Oklahoma. https://iqc.ou.edu/2014/12/12/60yrsmidwest/
Map of Chicago, Illinois. (n.d.). GISGeography. https://gisgeography.com/chicago-map-illinois/
Massachusetts Bay Transportation Authority. (2024). Subway Schedules & Maps. MBTA. Retrieved December 11, 2024, from https://www.mbta.com/schedules/subway
NYU Center on Race, Inequality, and the Law. (2024). Fighting for Equity in Transportation Policy and Infrastructure. NYU Center on Race, Inequality, and the Law. https://www.law.nyu.edu/centers/race-inequality-law/our-work/race-and-community-equi
This document highlights the historical connection between racism and the development of transit networks in the United States. This paper highlights the connection between Jim Crow laws and segregationist policies. These negative parts of public transportation systems such as highways have been implemented in areas of cities dominated by people of color, while the positive parts of transit are designed with white accessibility in mind. The parts of public transit that do serve low-income people and people of color are consistently less reliable and accessible and are often chronically underfunded. A lack of investment into black and brown neighborhoods has worsened the negative events such as Hurricane Katrina and COVID. This paper provides historical context for the current public transit system in the US, which provides some essential framing for my paper.
Purifoye, G. Y. (2020). Transit boundaries: race and the paradox of immobility within mobile systems. Mobilities, 15(4), 480–499. https://doi.org/10.1080/17450101.2020.1738684
This article discusses the role that transportation plays in the segregation and gentrification of chicago. The paper discusses how transportation in the US is more of a spoke-and-hub design, which works to separate and segregate different communities. In Chicago, for example, the red line services the predominantly black parts of chicago while also receiving significantly less upgrades and improvements, compared to parts of chicago that are white-dominated. The paper also discusses the ways that transportation is used as a tool of gentrification and a way of enticing white people to move to areas in order to gentrify them. The paradox of immobility is about how, despite the fact that black and latino people are the people who use public transit the most, these systems are specifically designed to isolate and segregate these communities from other, whiter, parts of town. Transportation within neighborhoods is good, but it is very hard to navigate between neighborhoods, which works to support segregatory practices. Transit centers in predominantly black parts of Chicago also had worse facilities and were more likely to be shut down for repairs while white neighborhood transit centers did not receive changes in access.
Race, Diversity, and Ethnicity in Boise, ID. (2020). Best Neighborhood. Retrieved November 20, 2024, from https://bestneighborhood.org/race-in-boise-id/
This website shows an interactive map of the larger Boise Area and displays the majority racial makeup in different parts of the city. Areas around Caldwell and Nampa have larger hispanic/latino populations, whereas most of the rest of Boise is white-dominated.
Régie Autonome des Transports Parisiens. (2024). Metro Map. Régie Autonome des Transports Parisiens. https://www.ratp.fr/en/plan-metro
Sen, B. (2022, January 27). How the U.S. Transportation System Fuels Inequality. Inequality.org. Retrieved December 2, 2024, from https://inequality.org/research/public-transit-inequality/
For decades, the US government has spent 4x as much on roads and highways as it has on public transit infrastructure. While many conservative politicians support road development and lobby against public transit investments, citing that public transit subsidies disproportionately benefit people living in urban areas, the amount spent on rural road and highway systems has actually decreased over the last three decades. 18% of American households don’t own a car, which means that these people are disproportionately negatively impacted by a lack of investment in public transit. White people are more likely to own a car (85.9%) than people of color, particularly black people (67.5%). Only 60% of people in the lowest quintile of income levels have a car, compared to more than 90% of the top quintile. Furthermore, the cost of owning a car is disproportionately high for lower income families. Oil and Gas companies pour money into the US elections (140 million dollars to candidates in the 2020 election alone) to ensure more money goes towards roads and not to public transit.
Spiller, C. (2020). Racism has shaped public transit, and it’s riddled with inequities. Rice University Kinder Institute for Urban Research.
https://kinder.rice.edu/urbanedge/racism-has-shaped-public-transit-and-its-riddled-inequities
This paper discusses the differences between a “choice” rider and a “dependent” rider. A choice rider is someone who has the option of using a private vehicle but chooses to use public transportation instead. A dependent rider is someone who is dependent on the public transportation system for moving around the city. The park-and-ride system is one example of transportation systems prioritizing choice riders. Oftentimes the park-and-ride systems have better amenities, provide a more comfortable and faster ride, and are often ridden by a white majority. In contrast, local bus networks are often underfunded, slow, lacking waiting shelters or other amenities, and are ridden by a majority of people of color. Because dependent riders rely on the local transit network to get around, these riders are often viewed as “not picky” and are left with the lower-quality systems of transportation. By contrast, choice riders are viewed as needing to be incentivized to ride public transit, which often results in a disproportionate amount of funds being allocated to choice riders. Investments in “choice” transit systems are used to fuel gentrification and are often accompanied by higher presences of police to maintain “white comfort.”
Stromberg, J. (2015). The real reason American public transportation is such a disaster. VOX. https://www.vox.com/2015/8/10/9118199/public-transportation-subway-buses
Most public transit systems in the US have significantly lower ridership rates, shorter service hours, and longer waiting times than other comparatively wealthy European and Asian countries, and yet we spend a higher percentage of taxpayer dollars subsidizing our public transit system than most other countries. One reason for this is the segregated white flight and urban sprawl that occurred in the mid-1950s. This sprawl meant that a lot of our public infrastructure money went towards developing highway networks rather than better public transit systems. However, urban sprawl and car-centric design are not the full answer. Cities in Canada are similarly designed to center cars and are more defined by urban sprawl, and yet these cities have significantly better public transit systems. One reason why American public transit is so bad is because it is viewed as a welfare system for people who cannot afford cars rather than a way of everyday life. In the US, fares are significantly lower than in many other countries. This low fare, combined with low ridership rates, means that our transit systems are operating in a deficit. By contrast, other countries have slightly higher fare rates, but because the systems are so robust there is a higher number of people using the transit systems, which results in a lower percentage of tax money being used to subsidize public transit. The viewing of public transit systems as welfare systems also allows the conversation surrounding transportation to be politicized, with rural and conservative representatives arguing that funding public transit instead of highways is harming their constituents. The politicization of public transit speaks to Spiller’s article, which highlights the relative spending on highways in the US. Spiller’s piece also discusses the role that lobbyists play in public transit development, which supports this article.
University of Waterloo Geospatial Centre. (2020). Toronto Transit Commission. University of Waterloo. https://uwaterloo.ca/library/geospatial/collections/canadian-geospatial-data-resources/greater-toronto-area-gta-mosaic-4-thumbnail/city-toronto-and-greater-toronto-area-gta/toronto-transit-commission-ttc
This webpage describes the public transit system in Toronto. Unlike many American Cities, the public transit system of Toronto is designed with interconnectedness in mind. Even though the city of Toronto is very car-centric, like many American cities, it still boasts a significantly better designed public transit system. The map of Toronto’s public exists in contrast to Chicago’s public transit system, which is mentioned in several sources.
Valley Regional Transit. (2023, September 16). Better Bus Routes: 2024 Network Redesign Final Proposal. ArcGIS StoryMaps. Retrieved November 20, 2024, from https://storymaps.arcgis.com/stories/441ddc9afbbf47938fabb715cdfcbac1
This website is the official 2024 proposal for Valley Regional Transit’s updates. The website depicts changes to the bus map, new additions of lines and on-demand systems to the city, and displays the old bus system. The proposal notes that “Historically, VRT has focused on a coverage-based system by providing routes in as many places as possible to connect passengers across the region.” The proposal also discusses the future goals of VRT, writing that “to increase the convenience of the system, grow ridership, and meet the desires of our riders we must move towards a higher frequency system. This requires focusing investments and increasing levels of service on higher ridership routes where we can better serve our existing riders and attract new riders.” The emphasis on attracting new riders, increasing convenience, and meeting the desires of riders are all signs that Boise is moving towards a neoliberal choice rider system.
Valley Regional Transit. (2024). Routes Archive. Valley Regional Transit. Retrieved November 20, 2024, from https://www.valleyregionaltransit.org/routes/
This website contains links to all of the bus routes currently offered by VRT. Blue lines run every 30-60 minutes, green lines run every 15-30 minutes, and purple lines run every 30 minutes during rush hour. Purple lines do not run during the middle of the day and do not run on the weekends. All buses do not run on Sundays. The only bus lines that run to Caldwell and Nampa are the lines 40 express, 42 regular, and 150 on demand. Express lines only run during rush hour, visit higher-desirability locations, have more comfortable accommodations, run longer distances, and cost 4x more than regular bus lines. On demand lines must be ordered via the phone app in advance and will pick people up within ¾ of a mile from where they requested and will drop them off within ¾ of a mile from their final destination. I will be using these maps as my main source of data for my paper. I plan to contrast the abundance of lines in whiter, wealthier parts of town with the lack of lines in the parts of Boise with higher Latino populations.